Output.2
| PolarSPARC |
Apache Spark 4.x Quick Notes :: Part - 3
| Bhaskar S | 11/30/2025 |
Overview
In any large Enterprise, a lot of time is spent in gathering and preparing data for any meaningful business analysis.
In other words, Data Preparation is a critical and time-consuming first phase for any data driven, business insights initiative. One typically spends about 80% of their total time in this phase. In this article, we are using the term Data Preparation to cover the following critical tasks:
Data Domain Knowledge - This task involves acquiring the data domain knowledege and having a good understanding about the various features (data attributes)
Exploratory Data Analysis - EDA for short, this task involves loading the raw data set for the data domain, performing initial analysis to gather insights from the loaded data set, understanding the various features and their types (discrete, continuous, categorical), identifying features with missing values, infering statistical information about the features (summary statistics, outliers, distibution), infering the relationships between the features, etc
Feature Engineering - This task involves using the information gathered from the EDA phase to encode the values of some of the categorical features to numerical, address missing values for some of the features, normalizing and scaling the feature values, adding additional features (derived features), etc
In this part of the Apache Spark series, we will demonstrate how one could leverage PySpark as a data pipeline for data cleansing and feature engineering.
For the hands-on demonstration, we will use the raw and uncleansed Palmer Penguins dataset (provided as a CSV file), which can be downloaded from HERE !!!
Hands-on Data Preparation PySpark (Local Mode)
As indicated in Part-2 of this series, RDDs are in maintenance mode and the direction is to move towards the use of Dataframes.
For the hands-on demonstration, we will rely on Dataframes for all processing.
Before proceeding, ensure that Java JDK 21 is installed and setup on the desktop.
Also, download and store the uncleansed Palmer Penguins dataset in the /tmp directory.
To setup the required environment variables, execute the following code snippet:
import os

os.environ['JAVA_HOME'] = '/usr/lib/jvm/jdk-21.0.9-oracle-x64'
os.environ['JDK_JAVA_OPTIONS'] = '--enable-native-access=ALL-UNNAMED'
Executing the above Python code generates no output.
To setup the a SparkSession in the local mode, execute the following code snippet:
from pyspark import SparkConf
from pyspark.sql import SparkSession

conf = (SparkConf()
        .setAppName('Spark Data Prep Local')
        .setMaster('local[1]')
)

spark = (SparkSession
         .builder
         .config(conf=conf)
         .getOrCreate()
)
Executing the above Python code generates no output.
To load the uncleansed Palmer Penguins CSV file and create a pyspark dataframe named penguins_df, execute the following code snippet:
penguins_df = spark.read.format('csv').load('/tmp/raw_penguins.csv', nullValue='NA', header=True)
Executing the above Python code generates no output.
To check the count of rows in the penguins_df dataframe, execute the following code snippet:
penguins_df.count()
Executing the above Python code generates the following typical output:
344
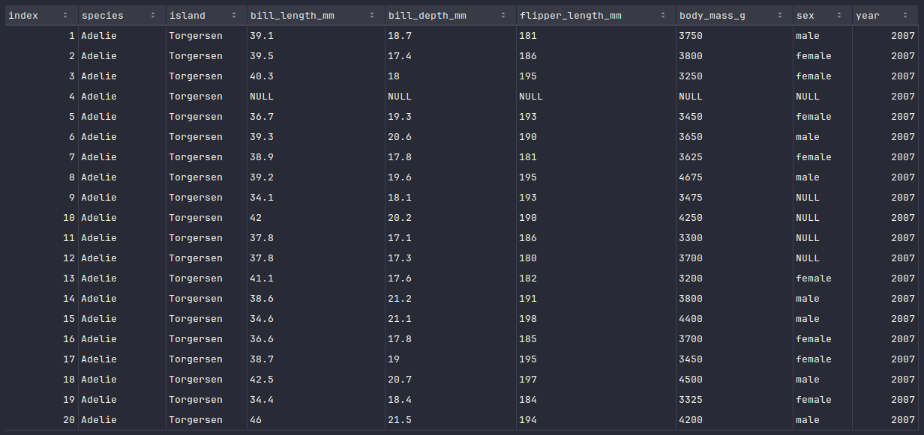
To display the top 20 rows of the penguins_df dataframe, execute the following code snippet:
penguins_df.show()
Executing the above Python code generates a typical output as shown in the illustration below:
To display the schema of the penguins_df dataframe, execute the following code snippet:
penguins_df.printSchema()
Executing the above Python code generates a typical output as shown in the illustration below:
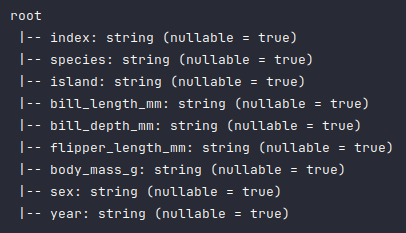
As is evident from the above schema output, all the columns have been detected as type string, which is not correct and needs to be fixed.
To fix the data types of some of the columns in the penguins_df dataframe, execute the following code snippet:
from pyspark.sql.types import FloatType, IntegerType

penguins_df = penguins_df.withColumn('index', penguins_df.index.cast(IntegerType()))
penguins_df = penguins_df.withColumn('bill_length_mm', penguins_df.bill_length_mm.cast(FloatType()))
penguins_df = penguins_df.withColumn('bill_depth_mm', penguins_df.bill_depth_mm.cast(FloatType()))
penguins_df = penguins_df.withColumn('flipper_length_mm', penguins_df.flipper_length_mm.cast(IntegerType()))
penguins_df = penguins_df.withColumn('body_mass_g', penguins_df.body_mass_g.cast(IntegerType()))
penguins_df = penguins_df.withColumn('year', penguins_df.year.cast(IntegerType()))
Executing the above Python code generates no output.
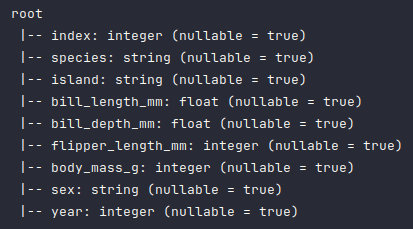
Once again, to display the corrected schema of the penguins_df dataframe, execute the following code snippet:
penguins_df.printSchema()
Executing the above Python code generates a typical output as shown in the illustration below:
To display all the rows with null values in the penguins_df dataframe, execute the following code snippet:
penguins_df.where(col('sex').isNull()).show()
Executing the above Python code generates a typical output as shown in the illustration below:
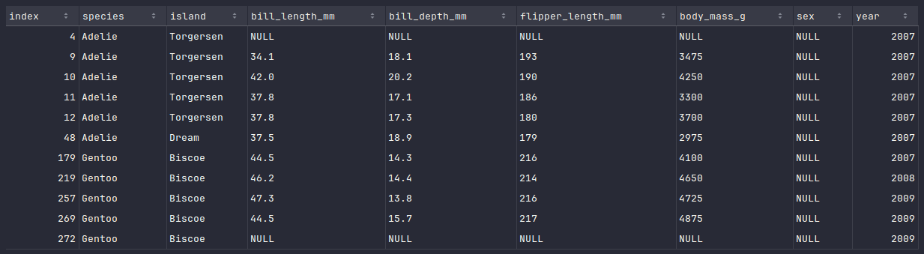
The rows with index 4 and index 272 are not useful and need to be out.
To drop rows with null values in the numerical columns of the penguins_df dataframe, execute the following code snippet:
penguins_df = penguins_df.dropna(subset=['bill_length_mm', 'bill_depth_mm', 'flipper_length_mm', 'body_mass_g'])
Executing the above Python code generates no output.
Once again, to display the count of rows in the penguins_df dataframe, execute the following code snippet:
penguins_df.count()
Executing the above Python code generates the following typical output:
342
We should now segregate the rows with null values from the rows without any missing values into two different dataframes.
To create a new dataframe called penguins_df_na with rows from the penguins_df dataframe containing null values, execute the following code snippet:
penguins_df_na = penguins_df_new.where(col('sex').isNull())
Executing the above Python code generates no output.
To display the rows of the penguins_df_na dataframe, execute the following code snippet:
penguins_df_na.show()
Executing the above Python code generates a typical output as shown in the illustration below:
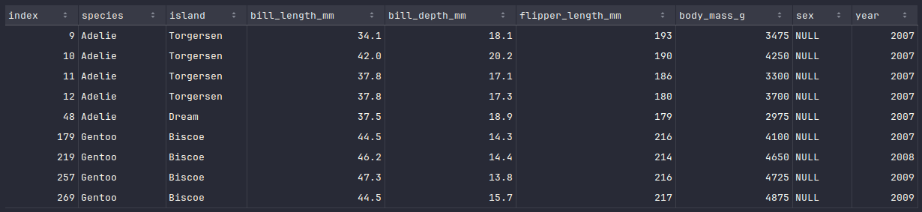
It is evident from the above Output.7 we are missing values for the column sex .
To create a new dataframe called penguins_df_filtered containing rows with no missing values from the penguins_df dataframe, execute the following code snippet:
penguins_df_filtered = penguins_df_new.where(col('sex').isNotNull())
Executing the above Python code generates no output.
To fill the missing values for the column sex in the penguins_df_na dataframe, one can look at each of the numerical column values and compare them to the minimum and maximum values of the corresponding columns from the penguins_df_filtered dataframe to determine if it is a female or male.
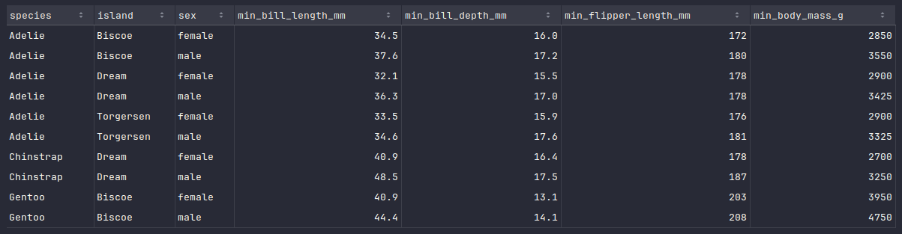
To create a new dataframe called penguins_df_min with minimum values for all penguin species and island from the penguins_df_filtered dataframe, execute the following code snippet:
from pyspark.sql.functions import min

min_list = [
  min('bill_length_mm').alias('min_bill_length_mm'),
  min('bill_depth_mm').alias('min_bill_depth_mm'),
  min('flipper_length_mm').alias('min_flipper_length_mm'),
  min('body_mass_g').alias('min_body_mass_g')
]

penguins_df_min = penguins_df_filtered.groupby('species', 'island', 'sex').agg(*min_list).orderBy('species', 'island', 'sex')
Executing the above Python code generates no output.
To display the rows of the penguins_df_min dataframe, execute the following code snippet:
penguins_df_min.show()
Executing the above Python code generates a typical output as shown in the illustration below:
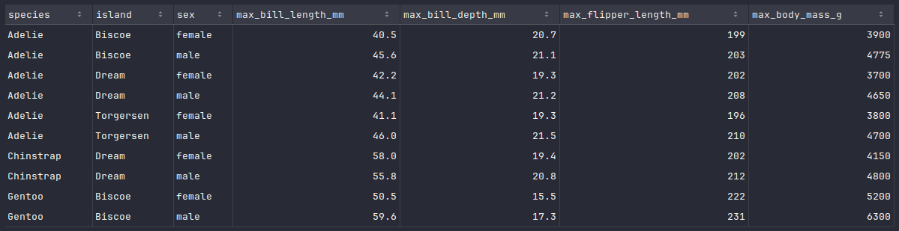
Similarly, to create a new dataframe called penguins_df_max with maximum values for all penguin species and island from the penguins_df_filtered dataframe, execute the following code snippet:
from pyspark.sql.functions import max

max_list = [
  max('bill_length_mm').alias('max_bill_length_mm'),
  max('bill_depth_mm').alias('max_bill_depth_mm'),
  max('flipper_length_mm').alias('max_flipper_length_mm'),
  max('body_mass_g').alias('max_body_mass_g')
]

penguins_df_max = penguins_df_filtered.groupby('species', 'island', 'sex').agg(*max_list).orderBy('species', 'island', 'sex')
Executing the above Python code generates no output.
To display the rows of the penguins_df_max dataframe, execute the following code snippet:
penguins_df_max.show()
Executing the above Python code generates a typical output as shown in the illustration below:
We will now implement a Python function, which will take the 3 dataframes - penguins_df_na, penguins_df_min, and penguins_df_min respectively as input and correct the missing values in the dataframe penguins_df_na.
Similarly, to create a new dataframe called penguins_df_max with maximum values for all penguin species and island from the penguins_df_filtered dataframe, execute the following code snippet:
from pyspark.sql.functions import when

def fix_missing_values(df_na, df_min, df_max):
  df_na_rows = df_na.collect()
  for row in df_na_rows:
    index = row['index']
    species = row['species']
    island = row['island']
    b_len = row['bill_length_mm']
    b_dep = row['bill_depth_mm']
    f_len = row['flipper_length_mm']
    b_mas = row['body_mass_g']
    # print(f'{index}, {b_len:.1f}, {b_dep:.1f}, {f_len}, {b_mas}')
    # Find the minimum values for a female of the specific species and island
    f_min = df_min.where((df_min.species == species) & (df_min.island == island) & (df_min.sex == 'female'))
    f_min = f_min.collect()[0]
    min_b_len = f_min['min_bill_length_mm']
    min_b_dep = f_min['min_bill_depth_mm']
    min_f_len = f_min['min_flipper_length_mm']
    min_b_mas = f_min['min_body_mass_g']
    # Find the maximum values for a female of the specific species and island
    f_max = df_max.where((df_max.species == species) & (df_max.island == island) & (df_max.sex == 'female'))
    f_max = f_max.collect()[0]
    max_b_len = f_max['max_bill_length_mm']
    max_b_dep = f_max['max_bill_depth_mm']
    max_f_len = f_max['max_flipper_length_mm']
    max_b_mas = f_max['max_body_mass_g']
    # If the features are within the range of the minimum and maximum values, then it is a female. Else, it is a male.
    if (b_len >= min_b_len) and (b_len <= max_b_len) \
      and (b_dep >= min_b_dep) and (b_dep <= max_b_dep) \
      and (f_len >= min_f_len) and (f_len <= max_f_len) \
      and (b_mas >= min_b_mas) and (b_mas <= max_b_mas):
      # print(f'{index}, {species}, {island}, {b_len:.1f}, {b_dep:.1f}, {f_len}, {b_mas} is a female')
      df_na = df_na.withColumn('sex', when(df_na['index'] == index, 'female').otherwise(df_na['sex']))
    else:
      # print(f'{index}, {species}, {island}, {b_len:.1f}, {b_dep:.1f}, {f_len}, {b_mas} is a male')
      df_na = df_na.withColumn('sex', when(df_na['index'] == index, 'male').otherwise(df_na['sex']))
  return df_na

penguins_df_na = fix_missing_values(penguins_df_na, penguins_df_min, penguins_df_max)
Executing the above Python code generates no output.
To display the rows of the fixed penguins_df_na dataframe, execute the following code snippet:
penguins_df_na.show()
Executing the above Python code generates a typical output as shown in the illustration below:
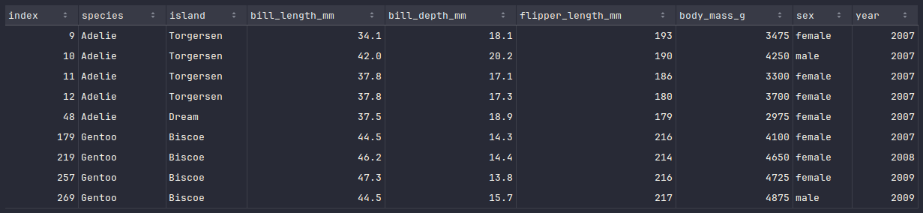
The next step is to create a new dataframe called penguins_df_clean by merging all the rows from the fixed penguins_df_na dataframe with the rows from the penguins_df_filtered dataframe.
To create the new merged dataframe called penguins_df_clean with clean rows, execute the following code snippet:
penguins_df_clean = penguins_df_filtered.union(penguins_df_na)
Executing the above Python code generates no output.
With this, we conclude the demonstration on how one can leverage pyspark for data preparation tasks !!!
References