Output.2
| PolarSPARC |
Apache Spark 4.x Quick Notes :: Part - 4
| Bhaskar S | 12/06/2025 |
Overview
In Part-3 of this series, we covered the topic on Data Preparation and provided a hands-on demonstration using the Palmer Penguin dataset.
In this part of the series, we will make use of the cleaned Palmer Penguin dataset, which can be downloaded from HERE for building a Machine Learning Classification model.
The Machine Learning Classification model will involve Feature Engineering, which comprises additional tasks, such as, encoding categorical features to numerical, normalizing and scaling the feature value(s), adding derived features (aggregates), etc.
Hands-on Machine Learning Classification using PySpark (Local Mode)
Before proceeding, ensure that Java JDK 21 is installed and setup on the desktop.
Also, download and store the cleansed Palmer Penguins dataset in the /tmp directory.
To setup the required environment variables, execute the following code snippet:
import os

os.environ['JAVA_HOME'] = '/usr/lib/jvm/jdk-21.0.9-oracle-x64'
os.environ['JDK_JAVA_OPTIONS'] = '--enable-native-access=ALL-UNNAMED'
Executing the above Python code generates no output.
To setup the a SparkSession in the local mode, execute the following code snippet:
from pyspark import SparkConf
from pyspark.sql import SparkSession

conf = (SparkConf()
        .setAppName('Spark ML Classification Local')
        .setMaster('local[1]')
)

spark = (SparkSession
         .builder
         .config(conf=conf)
         .getOrCreate()
)
Executing the above Python code generates no output.
To load the cleansed Palmer Penguins CSV file and create a pyspark dataframe named penguins_df, execute the following code snippet:
penguins_df = spark.read.format('csv').load('/tmp/penguins.csv', header=True)
Executing the above Python code generates no output.
To check the count of rows in the penguins_df dataframe, execute the following code snippet:
penguins_df.count()
Executing the above Python code generates the following typical output:
342
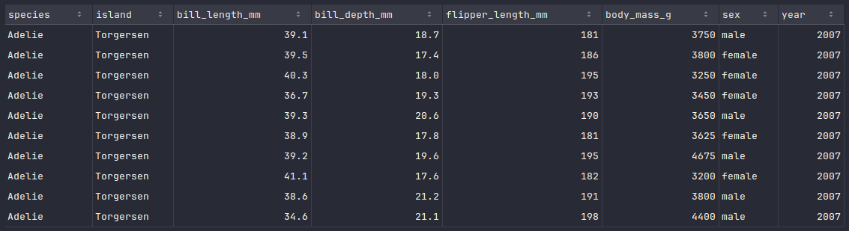
To display the top 10 rows of the penguins_df dataframe, execute the following code snippet:
penguins_df.show(10)
Executing the above Python code generates a typical output as shown in the illustration below:
To display the schema of the penguins_df dataframe, execute the following code snippet:
penguins_df.printSchema()
Executing the above Python code generates a typical output as shown in the illustration below:
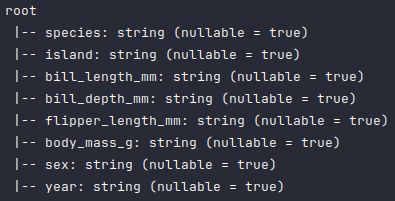
As is evident from the above schema output, all the columns have been detected as type string, which is not correct and needs to be fixed.
To fix the data types of some of the columns in the penguins_df dataframe, execute the following code snippet:
from pyspark.sql.types import FloatType, IntegerType

penguins_df = penguins_df.withColumn('bill_length_mm', penguins_df.bill_length_mm.cast(FloatType()))
penguins_df = penguins_df.withColumn('bill_depth_mm', penguins_df.bill_depth_mm.cast(FloatType()))
penguins_df = penguins_df.withColumn('flipper_length_mm', penguins_df.flipper_length_mm.cast(IntegerType()))
penguins_df = penguins_df.withColumn('body_mass_g', penguins_df.body_mass_g.cast(IntegerType()))
Executing the above Python code generates no output.
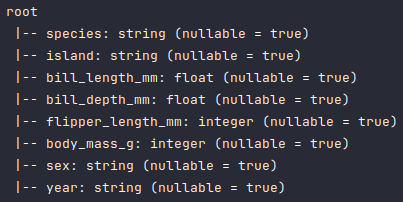
Once again, to display the corrected schema of the penguins_df dataframe, execute the following code snippet:
penguins_df.printSchema()
Executing the above Python code generates a typical output as shown in the illustration below:
Note that the Machine Learning models only work with numerical values. So, we will need to convert the Categorical values in the columns species, island, and sex.
The StringIndexer class in PySpark allows one to convert string values to numerical index values.
To convert the above mentioned 3 categorical columns in the penguins_df dataframe to numerical values, drop the 3 mentioned categorical columns plus the year column, and create a new dataframe called penguins_df_indexed, execute the following code snippet:
from pyspark.ml.feature import StringIndexer

indexer = StringIndexer(
  inputCols=['species', 'island', 'sex'],
  outputCols=['species_index', 'island_index', 'label']
)

penguins_df_indexed = (
  indexer
    .fit(penguins_df)
    .transform(penguins_df)
    .drop(*['species', 'island', 'sex', 'year'])
)
Executing the above Python code generates no output.
To display the top 10 rows from the penguins_df_indexed dataframe, execute the following code snippet:
penguins_df_indexed.show(10)
Executing the above Python code generates a typical output as shown in the illustration below:

All the PySpark machine learning models (in the Spark MLlib module) expect all the features in a PySpark dataframe to be represented as a numerical vector in a single column called features, along with a single target column called label.
The VectorAssembler class in PySpark allows one to convert a set of numerical columns into a single numerical vector column.
To convert all the numerical columns (except the label column) from the above penguins_df_indexed dataframe to a numerical vector column, drop all the numerical columns (except the label column), and create a new dataframe called penguins_df_vectorized, execute the following code snippet:
from pyspark.ml.feature import VectorAssembler

assembler = VectorAssembler(
  inputCols=['species_index', 'island_index', 'bill_length_mm', 'bill_depth_mm', 'flipper_length_mm', 'body_mass_g'],
  outputCol='features'
)

penguins_df_vectorized = (
  assembler
    .transform(penguins_df_indexed)
    .drop(*['species_index', 'island_index', 'bill_length_mm', 'bill_depth_mm', 'flipper_length_mm', 'body_mass_g'])
)
Executing the above Python code generates no output.
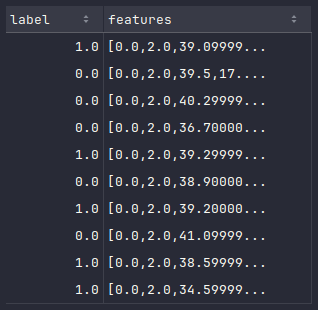
To display the top 10 rows from the penguins_df_vectorized dataframe, execute the following code snippet:
penguins_df_vectorized.show(10)
Executing the above Python code generates a typical output as shown in the illustration below:
In any machine learning model training exercise, the dataset is split into a training set and a test set, which is typically a 80/20 split respectively.
To create the training set and the test set from the penguins_df_vectorized dataframe, execute the following code snippet:
train_set, test_set = penguins_df_vectorized.randomSplit([0.8, 0.2], seed=5)
Executing the above Python code generates no output.
For machine learning classification tasks, one can leverage the Logistic Regression model.
To create and traing a Logistic Regression classification model on the train_set dataframe, execute the following code snippet:
from pyspark.ml.classification import LogisticRegression

lr = LogisticRegression(featuresCol='features', labelCol='label', regParam=1.0)

lr_model = lr.fit(train_set)
Executing the above Python code generates no output.
To display the values of model intercept and coefficients post the model training, execute the following code snippet:
print(lr_model.interceptVector, lr_model.coefficients)
Executing the above Python code generates the following typical output:
[-4.411943437211087] [-0.04629729980664915,0.011743344552874214,0.020733246617217146,0.08602615735837658,0.005847646527103863,0.00020128119817813892]
To use the trained Logistic Regression model to predict the outcome using the test_set dataframe, execute the following code snippet:
prediction_df = lr_model.transform(test_set)
Executing the above Python code generates the following typical output:
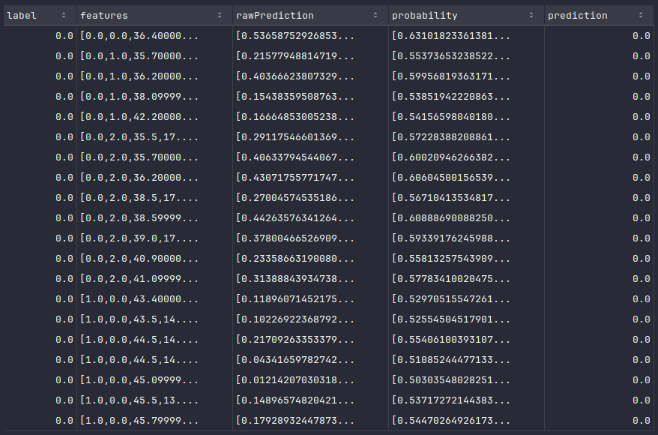
To display the top 20 default rows from the prediction_df dataframe, execute the following code snippet:
prediction_df.show()
Executing the above Python code generates a typical output as shown in the illustration below:
To evaluate the accuracy of trained Logistic Regression model using the prediction_df dataframe, execute the following code snippet:
from pyspark.ml.evaluation import MulticlassClassificationEvaluator

evaluator = MulticlassClassificationEvaluator(metricName='accuracy')

print(f'Accuracy: {evaluator.evaluate(prediction_df)}')
Executing the above Python code generates the following typical output:
Accuracy: 0.9245283018867925
With this, we conclude the demonstration on how one can leverage pyspark for Machine Learning Classification tasks !!!
References